Gap Analysis

Guiding question
Where is there a difference between the ACTUAL and TARGET state?
Objectives
- Recognize where the objectives of communication have not yet been achieved
- Identify strategic levers for achieving goals
- Develop priorities for measures and allocate available resources optimally (cf. Tool 89, Cost-Benefit Analysis)
Implementation
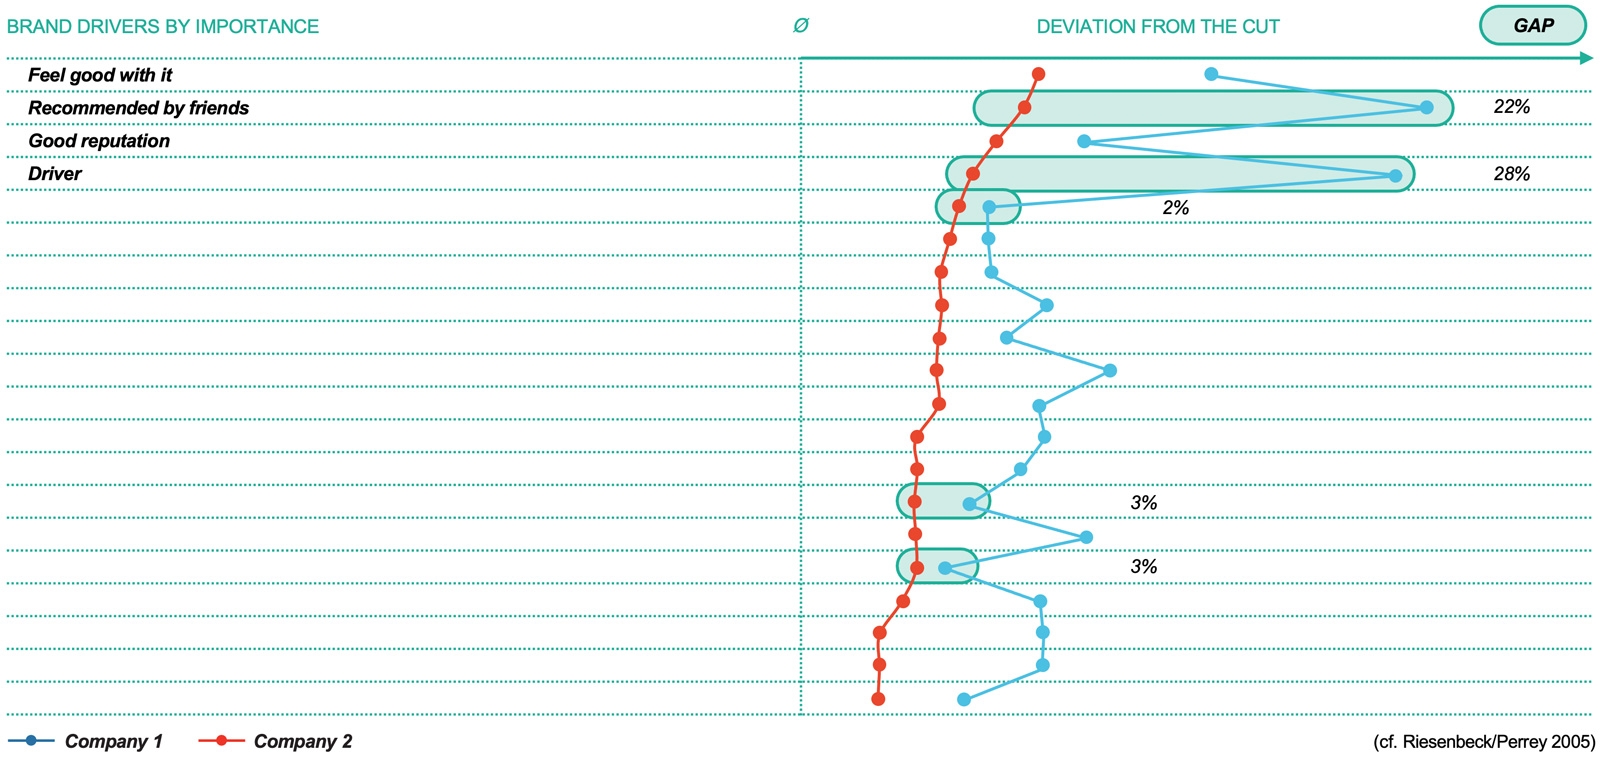
Most of the analysis tools presented here can also be used to define objectives, e.g., the Denison Cultural Survey (Tool 8), the Commitment Index (Tool 7) or the Image Survey (Tool 5). If both the ACTUAL and TARGET values are entered in such a tool, the target deviation (gap) between the current state and the target value, e.g., for topics or media use, can be seen at a glance. Alternatively, the deviations between the values of the own company compared to the competition are presented.
The typical steps of the gap analysis are:
- The ACTUAL state is presented in tabular or visual form.
- The TARGET state is displayed.
- The comparison of ACTUAL and TARGET makes the target deviation clear.
- Needs for action are formulated with priorities.
Theory: Gap analysis
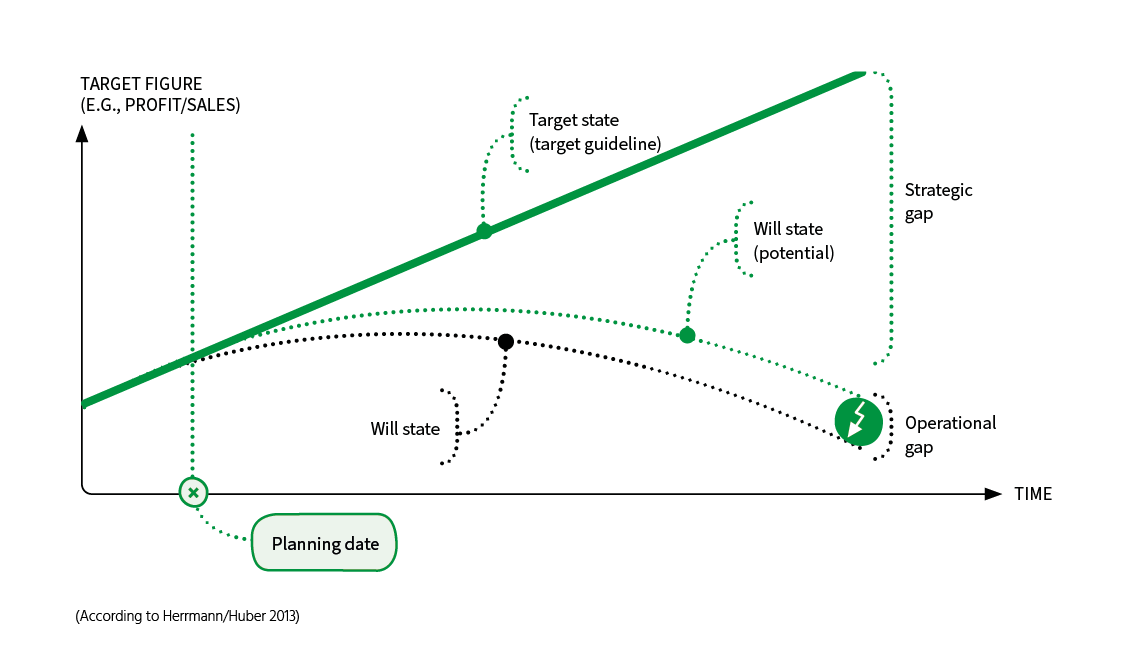
With the gap analysis, strategic and operational gaps between the target (TARGET) and the expected development can be identified. Different future projections (scenarios) are compared with each other.
It is assumed as a necessary assumption that no unplanned corporate activities take place during this period. Developments in the environment for the period under review are also presented ceteris paribus, i.e., they are not included in the analysis. Nevertheless, gap analysis is considered a good early warning tool and activity prioritization tool.
The gap analysis in business administration graphically relates the environment analysis and the company analysis: on the one hand, medium-term company goals such as Turnover, Profit or Return on investment and the path towards them (milestones), and on the other hand expected values, which are determined by extrapolating past values. Gaps in the company's policy and its implementation become apparent, and measures can be developed to close these gaps.

